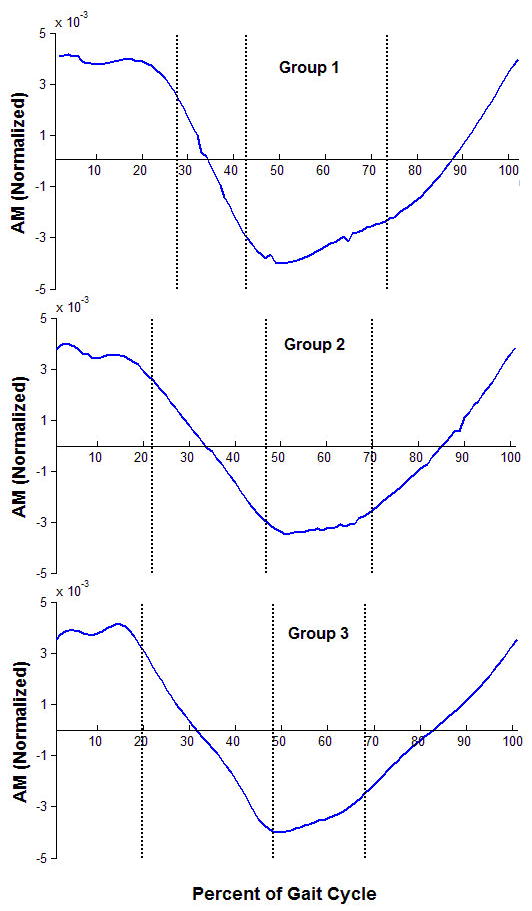
Figure 1.

Group average data for H for three groups of persons with hemiparesis: Slow walkers (0-0.4m/s, top), medium walkers (0.4-0.8m/s, middle), and fast walkers (0.8-1.2m/s, bottom).The three vertical lines represent the average transitions between Regions 1-2, 3-4, and 4-5 (i.e., the transitions between double support phases – Regions 1 and 4). The transitions between Regions 2-3 and 5-6 are not shown but are at the midpoint of the single support phases.
