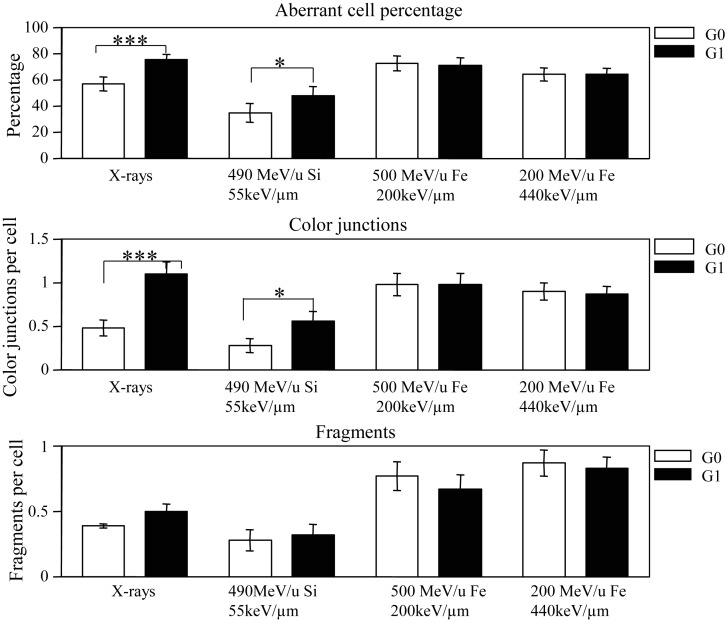
Fig. 5.
Chromosome aberrations in human fibroblast AG01522 cells exposed to X-rays (6 Gy), Si490 (2 Gy), Fe500 (2 Gy) and Fe200 (2 Gy) analyzed by FISH painting. Aberrant cell percentage, color-junction per cell and fragments per cell in non-cycling G0 and cycling G1 cells after 12-h incubation were shown. Open bars show G0 chromosome aberrations (delayed plating) and closed bars show G1 aberrations (immediate plating). The error bars are standard errors of the means. A statistically significant difference between non-cycling G0 and cycling G1 phase cells is indicated by *(P < 0.05), ***(P < 0.005).

