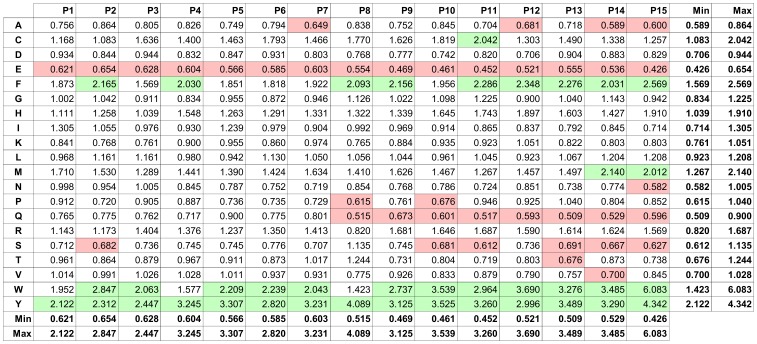
Figure 3. Ratio PWM of amino acids in peptides that were “binding” versus those that were “non-binding” to IVIG antibodies.
The PWM has been created using all 15-mer peptides from the training set. Each component of the PWM corresponds to the ratio of the frequency of the occurrence of a given amino acid (row) at a given peptide position (column) in “binding” vs. “non-binding” peptides. Amino acids Y, W, and Y have the highest binding ratios, whereas amino acids E, Q, and N have the lowest ratios. Green shading represent amino acids that are more abundant in “binding” peptides than in “non-binding” ones (threshold>2). In contrast, red shading labels amino acids that are more abundant in “non-binding” peptides (threshold <0.7). The range of values in each column and row is indicated by minima (Min) and maxima (Max).

