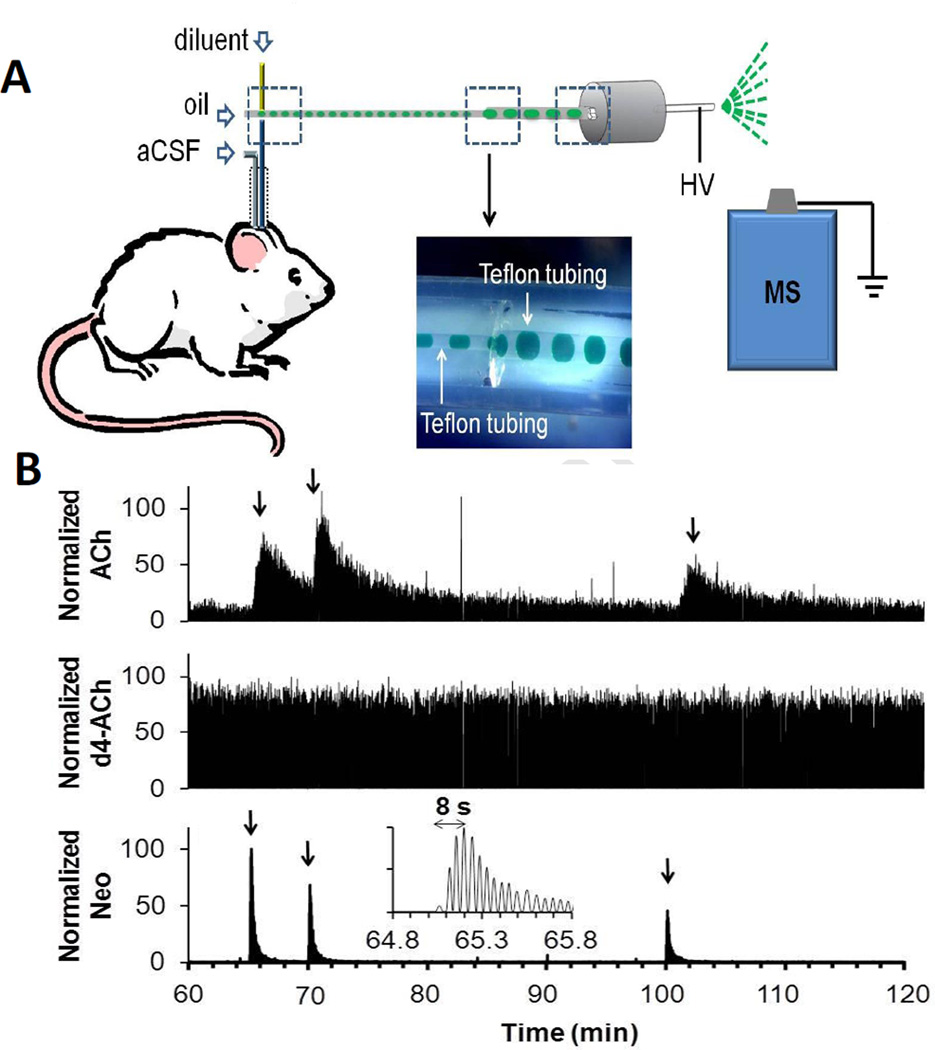
Figure 3.
Illustration of segmented flow sampling and coupling to mass spectrometry. (A) Dialysate is pumped into a cross fluidic structure mounted on the subject’s head. In the cross, fluorinated oil and internal standard solution are pumped into separate arms. Resulting segmented flow emerges from the fourth arm and is pumped to the electrospray source of the mass spectrometer (MS). Inset shows a photo where aqueous solution of green dye was sampled and segmented within the cross by perfluorodecalin. HV stands for high voltage. (B) Recording of response to in vivo microinjection of neostigmine obtained using system in A with probe inserted in the striatum of a rat. Figure shows a sample trace for simultaneous detection of acetylcholine (ACh), internal standard, d4-acetylcholine (d4-ACh), and (C) neostigmine (Neo). Each compound is recorded at a specific m/z by the mass spectrometer. Arrow indicates beginning of each microinjection. Insert is a magnified view of the 1st microinjection for neostigmine detection showing the detection of individual droplets and rapid response time possible. (Adapted from [42]).

