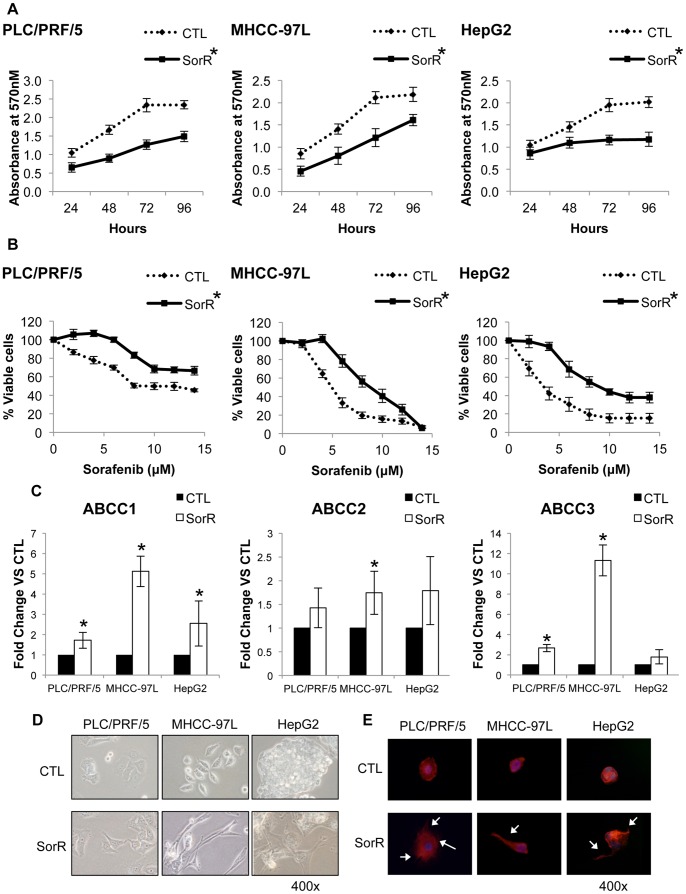
Figure 1. Establishment of SorR cells using HCC cell lines.
PLC/PRF/5, MHCC97L and HepG2 cells were cultured at maximal tolerated dose of sorafenib to obtain the CTL and SorR cells derived from each cell line. A) CTL and SorR cells were cultured at 0–14 µM sorafenib and MTT assay was performed 72 hours after treatment. B) Total RNA from CTL and SorR cells were extracted to perform the qPCR analysis of ABCC1, ABCC2 and ABCC3. C) Representing images of CTL and SorR cells under a phase-contrast microscopy (magnification: 400x). D) CTL and SorR cells were stained with phalloidin (red) and counterstained by DAPI (blue). Representing images of CTL and SorR cells under a fluorescence microscopy (magnification: 400x). Cellular protrusions were indicated by arrows. Data are presented as means ± SD from three independent experiments. *p<0.05 vs. CTL cells by one-way ANOVA.

