
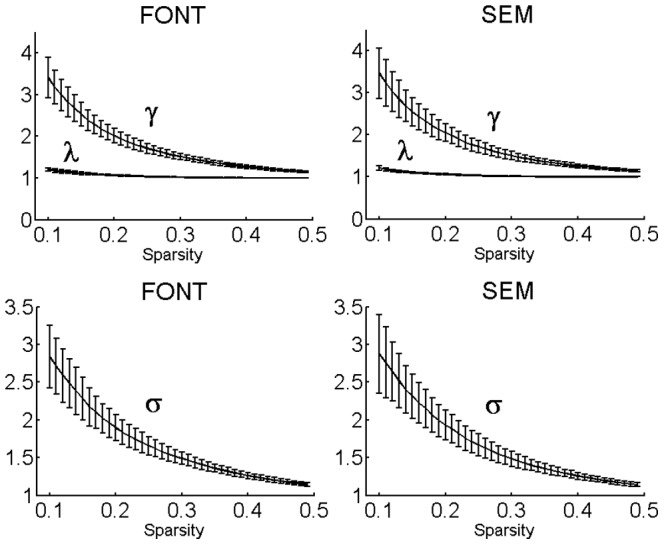
Figure 2. Small-world properties changing with the varied sparsity of the functional networks for both the explicit and implicit language tasks.
Here  stands for the normalized clustering coefficient,
  for the normalized characteristic path length, and σ for the ratio of
  to
to  . The values of
  and
and were evaluated on each individual brain network and then averaged over all subjects in the explicit and implicit language tasks, respectively. In a wide range of sparsity (0.10 ≤ sparsity ≤ 0.49), the functional networks for the implicit or explicit language tasks exhibit
  >1,
>1,  ≈1, and σ> 1.1, which indicated prominent small-world properties.