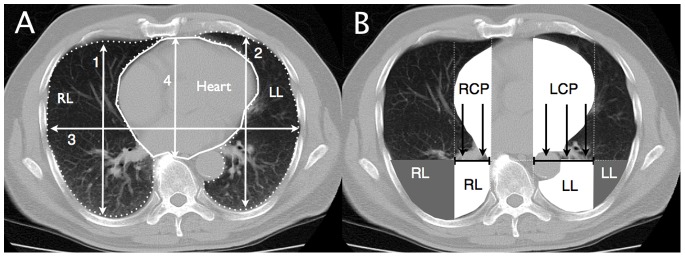
Figure 1. Figure shows a schematic representation of the CT image parameters analyzed.

Panel A shows rib cage dimensions (numbered white arrows), cardiac silhouette (continuous white line contour) and lung boundaries (dotted white line contours) on a representative CT section located 1 cm above the diaphragm. Numbers 1 and 2 identify right and left anteroposterior sagittal distances, number 3 the maximal thoracic transverse distance, number 4 the sternovertebral distance and number 5 the cardiac transverse diameter (dashed line). Panel B shows a schematic representation of the orthogonal pressure (black arrows) exerted by the left (LCP) and right (RCP) cardiac protrusions (white cardiac segments) on subjacent surface (tipped black solid lines) of lower lobes located beneath the heart (white lung areas). Parts of lower lobes located outside of heart limits are represented in gray.
