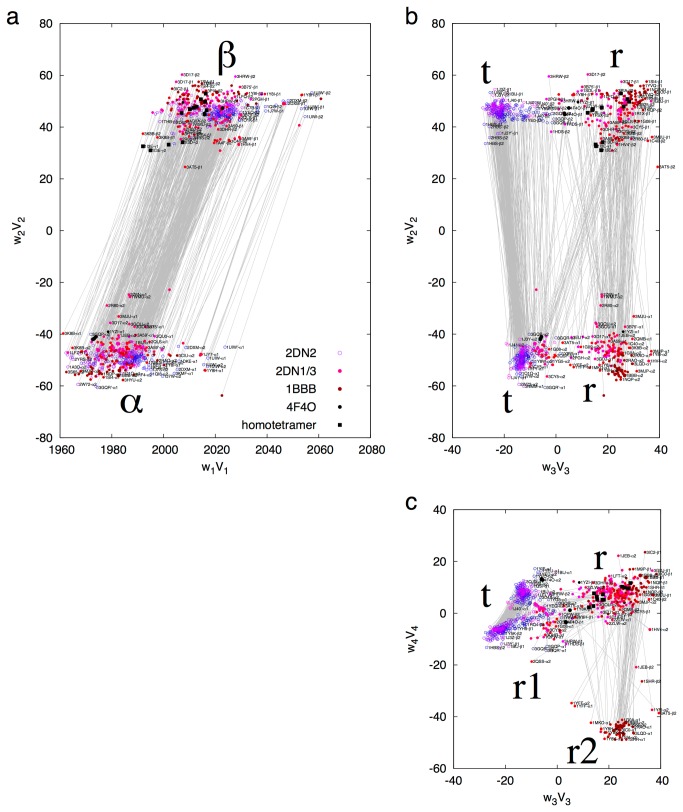
Figure 3. Combined conformational space of α and β.
SVD is performed on more than 1,000 distance matrices of the equivalent residues of α and β. The 5-residue insertion in CDβ and 2-residue insertion in ABα are excluded in the calculation. The coefficient sets w k V k with k = 1, …, 4 are plotted in a - c. The continuous color scheme is the same as in Figure 2. In addition, all subunits on T side of the allosteric taboo gap are represented by open circles, and those on R side are in solid dots. Four subunits from the structure of free dimers (4F4O) are in black dots. Those β and γ subunits from the abnormal homotetrameric Hbs are in black squares. Two subunits from a same dimer are linked by a gray line. PDB entries are labeled by small typeface whenever possible, and are only visible on a digital copy. The decomposed lower triangles are in Figure S8.

