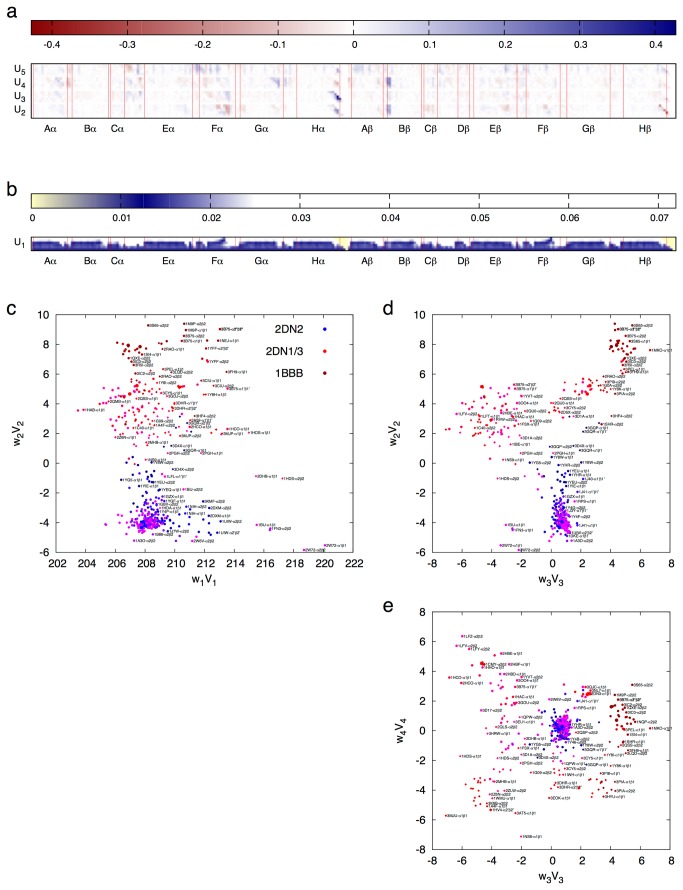
Figure 6. SVD analysis of HIMs.
SVD analysis is applied to HIMs of 560 αβ dimers in the structural collection. a. Left singular vectors U2 - U5. b. Left singular vector U1. This can be considered as the average of all 560 HIMs. c - e. Scatter plots of the first four dimensions of SVD. For example, each value of w 2V2 indicates how much composition of U2 is required by an HIM. Dimers are labeled by small typeface as much as possible if the labeling is not interfering with other graphing, and are only visible on a digital copy. The continuous color scheme is identical to that in Figure 2. Structures of human and non-human Hb are indicated by solid dots and diamonds, respectively.

