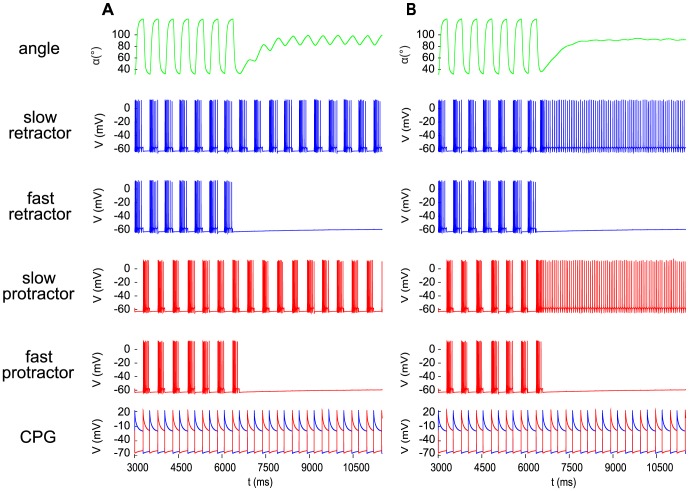
Figure 5. The effect of inhibition of the fast motoneurons.
The angular movement and the neuronal activities displayed in the panels are the same as in Fig. 4. Inhibition was brought about in the model by reducing the value of both conductances  and
and  of the inhibitory currents to the interneurons IN1 and IN3, respectively (cf. Fig. 1), from
  to
to  A: leaving the values of the conductances
  and
and  at IN2 and IN4, respectively, unchanged at
  (no change to the input of the slow MNs); B: increasing the values of these conductances to
  (disinhibition of the slow MNs). Note the large difference in the amplitude of the oscillation after the onset (at
  ) of the inhibition to the fast MNs.

