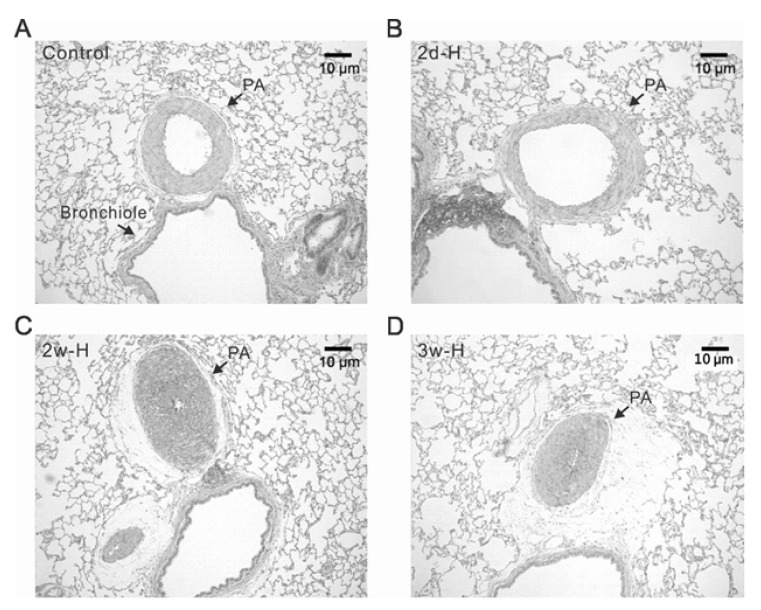
Fig. 2.
Differential structural changes of PAs according to the period of hypoxia in rats. Representative histological figures (H&E staining) of lung from control (A), 2 days of hypoxia (2d-H, B), 2 weeks of hypoxia (2w-H, C), and 3 weeks of hypoxia (3w-H, D). The medial thickness of PA was similar between control and 2d-H, whereas the PAs from 2w-H and 3w-H showed marked hypertropic changes with almost obliterated lumen.

