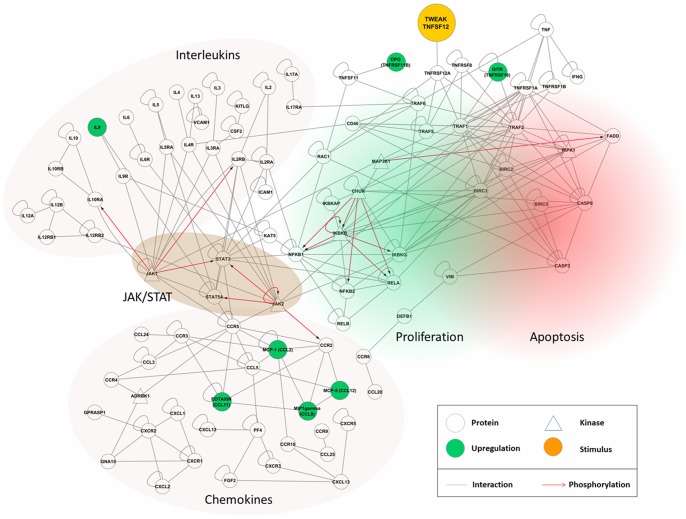
Figure 5. HSA-Flag-TWEAK treatment modulates the expression of cytokines and chemokines via NFκB and JAK/STAT-signalling.
The protein-protein interaction network maps cytokine and chemokine data from the protein microarrays onto the human interactome. Circles indicate proteins; kinases are depicted in triangular shape, each specified by gene names. They are connected either by gray lines indicating protein-protein interactions or red arrows denoting phosphorylation reactions. The functional entities are highlighted (interleukins, chemokines, JAK/STAT pathway). Green-colored nodes show up-regulation in the TWEAK stimulation (orange) condition.

