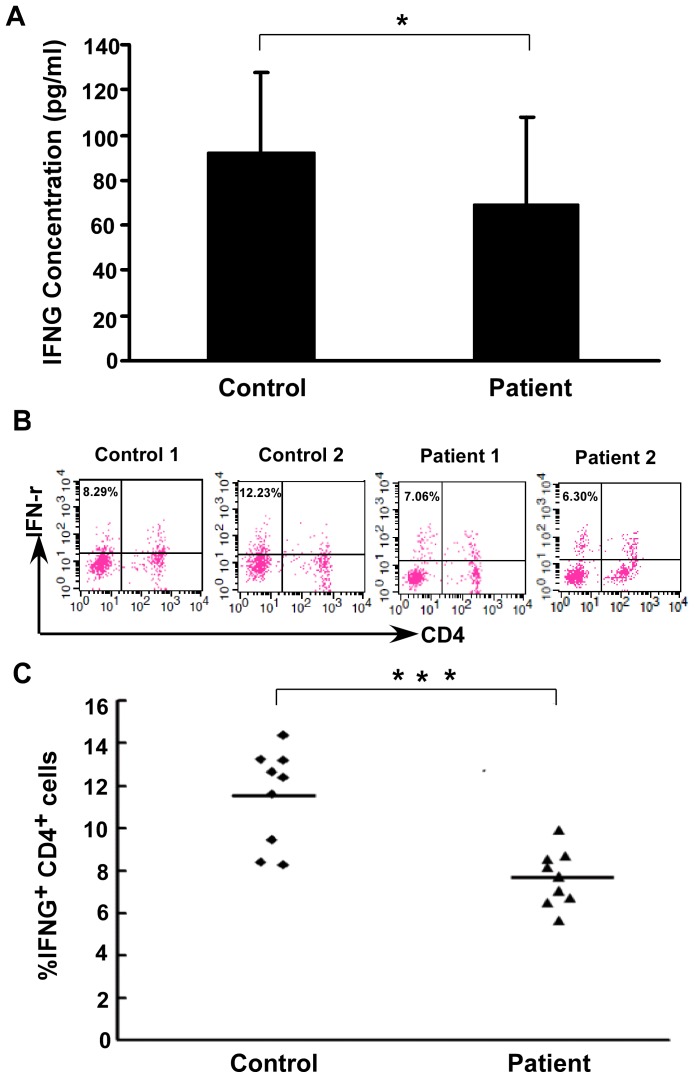
Figure 1. IFNG levels of healthy controls and lung cancer patients.
(A) Comparison of plasma IFNG levels in study groups. ELISA was used to measure plasma IFNG levels in 30 lung cancer patients and 30 healthy controls. Plasma IFNG levels in patients and healthy controls were 69.30±38.56 pg/ml and 92.62±34.75 pg/ml respectively (*P = 0.017). (B) Representative results of IFNG expression by CD4+ T cells from lung cancer patients (n = 2) and healthy controls (n = 2). (C) Flow cytometric analysis of IFNG levels in study groups. Data are the individual frequency from lung cancer patients (n = 9) and healthy controls (n = 9). Horizontal bars indicate the group means. Independent t tests were used to calculate P values (***, P<0.001).

