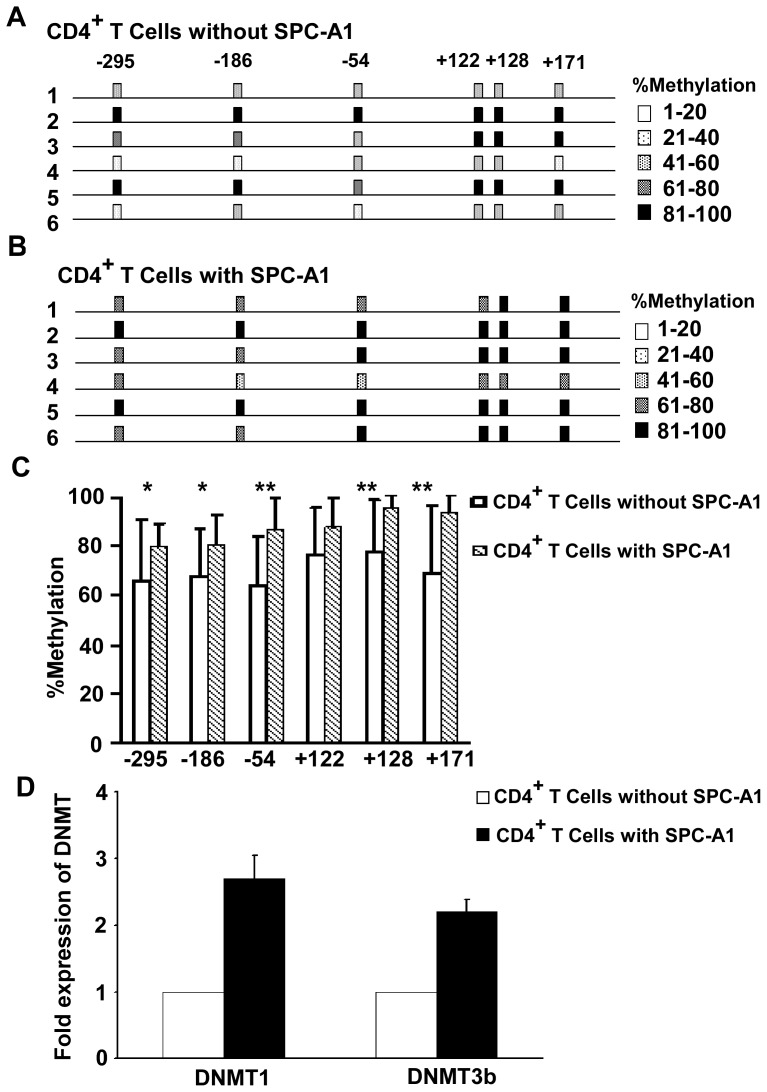
Figure 4. Hypermethylation status of the IFNG promoter in CD4+ T Cells co-cultured with SPC-A1.
(A) Gene map of the methylated IFNG promoter in CD4+ T cells cultured without SPC-A1 from 6 healthy volunteers. The degree of methylation at each CpG site is depicted by the strength of shading. (B) Gene map of the hypermethylated IFNG promoter in CD4+ T cells cultured with SPC-A1 from 6 healthy volunteers. The degree of methylation at each CpG site is depicted by the strength of shading. (C) Methylation of CpG sites in the IFNG promoter was significantly different between CD4+ T cells cultured with or without SPC-A1 cells. Graph summarizing the percent of methylated CpG site observed at each position analyzed. IFNG promoter shows hypermethylation among CD4+ T cells cultured with SPC-A1 cells compared with CD4+ T cells cultured without SPC-A1 cells. Chi-square test contingency table was used to assign P values. Comparison of CD4+ T cells cultured with SPC-A1 cells vs CD4+ T cells cultured without SPC-A1 cells (error bars, SD, * P<0.05; ** P<0.01). (D) Total RNA extraction and quantitative RT-PCR was performed to quantify DNMT1 and DNMT3b mRNA levels. The mRNA levels were normalized to β-actin. They were showed to be the ratios of CD4+ T cells cultured with or without SPC-A1 cells, from three independent experiments, expressed as mean ± SD.

