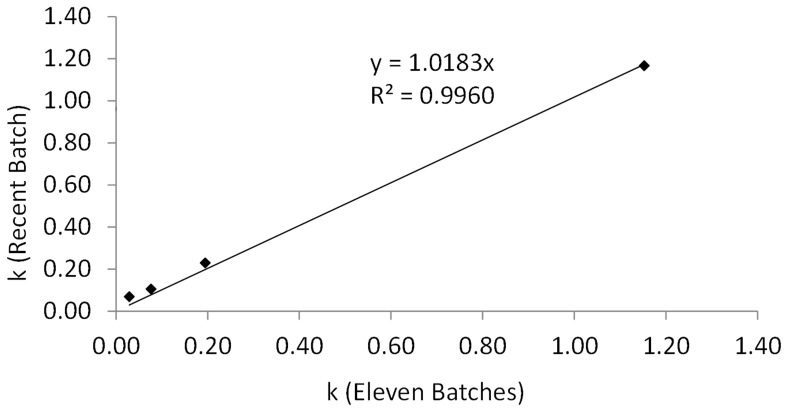
Figure 5. Comparison of the obtained and predicted k values.
Observed k values obtained with stability studies of the recent batch during six months, against the k values obtained with the Arrhenius equation of the eleven batches of Bacilor® (Lcr restituo® capsules) (the k value at 40°C for the eleven batches was not available and was predicted with the Arrhenius equation).

