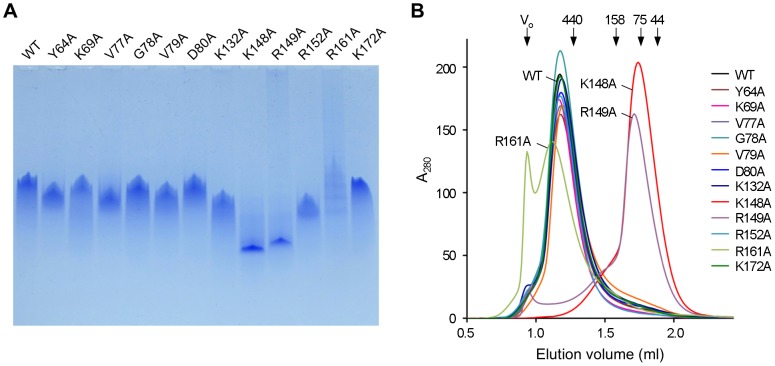
Figure 6. Characterization of the oligomeric structure of Redβ mutant proteins.
(A) Native PAGE analysis of Redβ protein variants. Proteins (10 µg per lane) were separated on a 5–20% gradient polyacrylamide gel and visualized by staining with Coomassie Blue. (B) Size-exclusion chromatography of Redβ mutants. Proteins (10 µl of 6 mg/ml) were applied to a Superdex 200 5/150 GL gel filtration column in 20 mM potassium phosphate pH 6.0, 10 mM MgCl2, 0.15 M NaCl. Molecular masses were estimated by constructing a calibration curve from known molecular mass standards: ovalbumin (44 kDa), conalbumin (75 kDa), aldolase (158 kDa) and ferritin (440 kDa).

