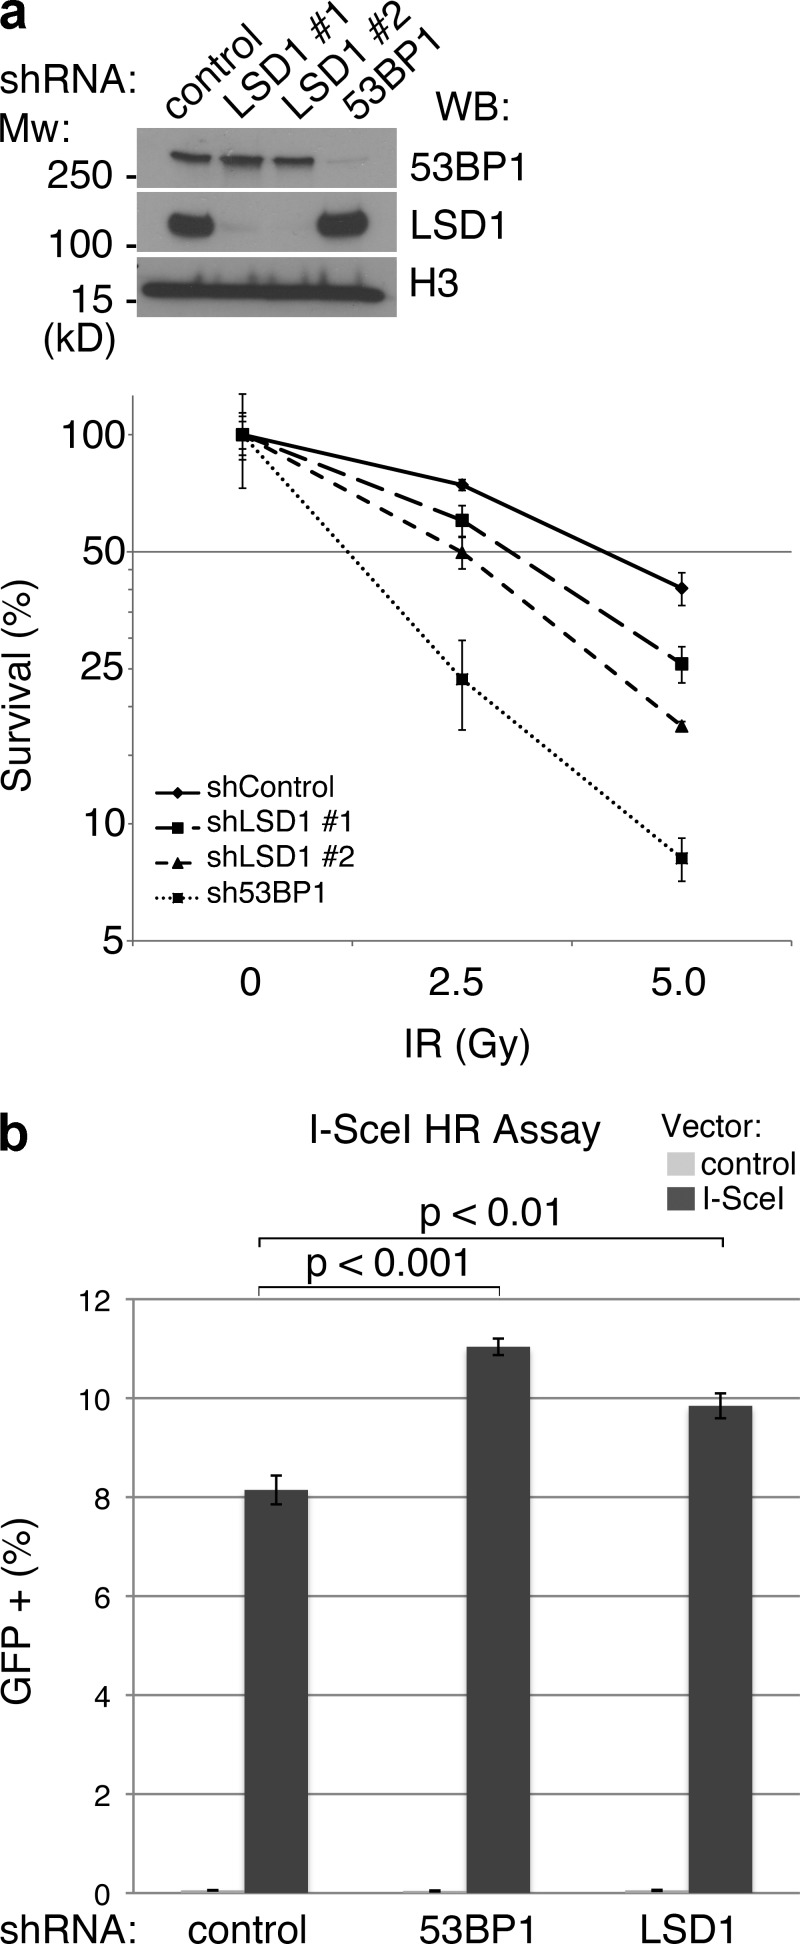
Figure 6.
LSD1 promotes the cellular response to DNA damage. (a) Lentiviral knockdown was performed in HeLa cells using the indicated shRNAs, followed by Western blotting as indicated (top). Colony formation assay was then performed in quadruplicate using the knockdown cells. Y axis represents colony survival normalized to control. (b) U2OS-DR-GFP reporter cells were treated with the indicated shRNAs, and frequency of HR was determined by flow cytometry after transfection with control or I-SceI vector. Error bars represent ± SD.

