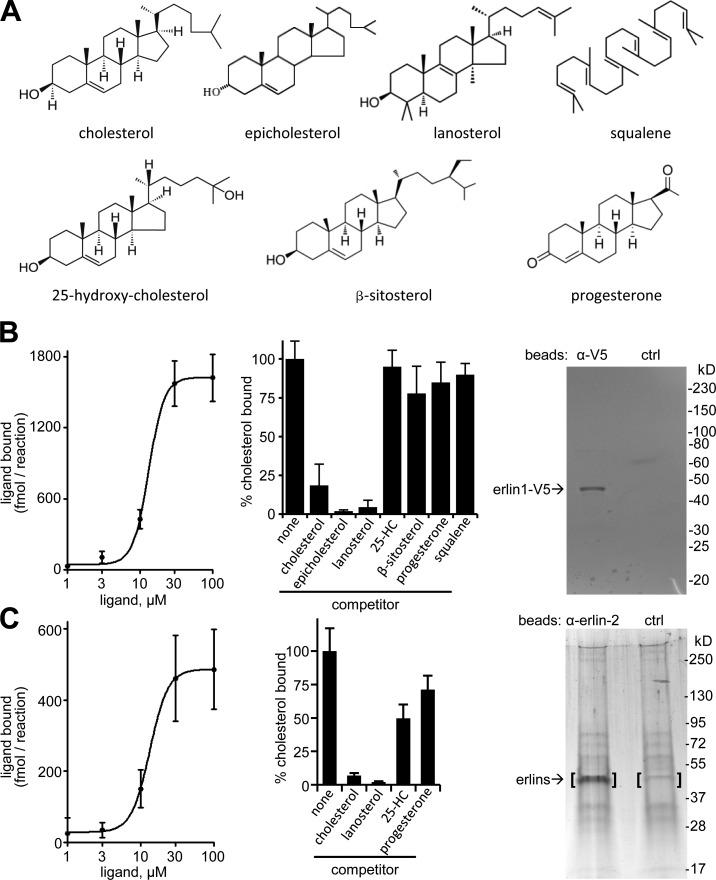
Figure 4.
Cholesterol binding by erlins. (A) Structures of cholesterol and related compounds used. (B) Analysis of purified recombinant erlin-1 with cholesterol binding and competition. Cholesterol binding curve (left), competition of 5 µM of radiolabeled cholesterol by 50 µM of the indicated nonlabeled compounds (middle), and analysis of purified erlin-1-V5 by SDS-PAGE and Coomassie blue staining (right). Shown is representative material eluted from anti-V5 beads (left lane) and control IgG beads (right lane). Densitometry established >90% purity for erlin-1-V5. Error bars indicate standard deviations. (C) Binding and competition of cholesterol to the erlin complex from mouse liver microsomal membranes. Left and middle panels are the same as in B. (right) SDS-PAGE with silver staining of material eluted from anti–erlin-2 beads (left lane) and control beads (right lane). The bracketed gel areas were analyzed by mass spectrometry. Erlin-1 (14.2% sequence coverage) and erlin-2 (18.2% sequence coverage) were found only in the anti–erlin-2 sample.

