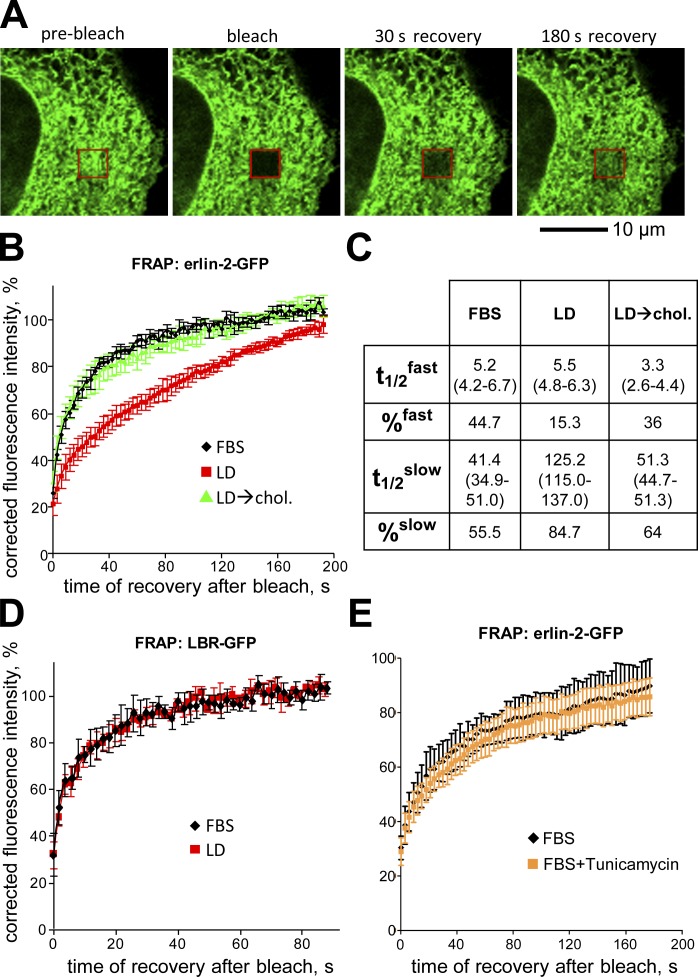
Figure 5.
Cholesterol-dependent changes in diffusional mobility of erlin-2. (A) Confocal images during FRAP of a HeLa cell expressing erlin-2-GFP. Shown are images before fluorescence bleaching (pre-bleach) or at the indicated times after bleaching (red box). (B) Plot showing FRAP of erlin-2-GFP under conditions of cholesterol sufficiency (FBS; black), cholesterol depletion (LD; red), or cholesterol depletion followed by incubation with 50 µM cholesterol–β-MCD complex for 3 h (LD→chol.; green). Shown are averaged data from n = 7 cells. (C) Table summarizing erlin-2-GFP FRAP data. t1/2 and percentage values were calculated from two-phase association functions best describing the FRAP curves shown in B. (D) Plot of FRAP of LBR-GFP under lipid-sufficient (FBS; black) and lipid-depleted (LD; red) conditions; n = 5 cells. (E) Plot of FRAP of erlin-2-GFP under lipid-replete conditions without (FBS; black) or with tunicamycin (FBS+Tunicamycin; orange) to induce ER stress; n = 6 cells. Error bars indicate standard deviations.

