Figure 4.
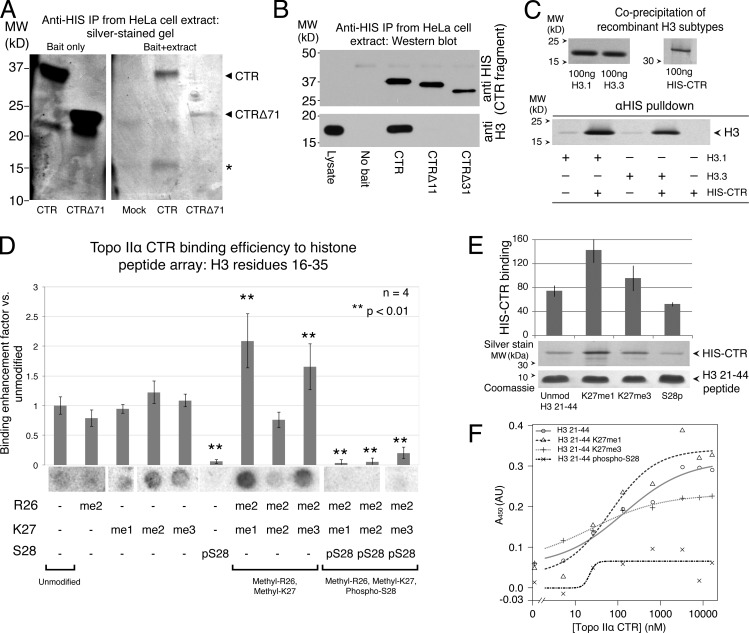
The Topo IIα CTR binds to the N-terminal tail of histone H3 in vitro. (A) Silver-stained SDS-PAGE gel reveals an ∼15-kD protein (asterisk) coprecipitated from HeLa lysates with HIS-tagged Topo IIα CTR (bait). The low–molecular weight protein was not precipitated in samples using HIS–Topo IIα CTRΔ71. (B) Immunoblot detecting immunoprecipitated recombinant HIS–Topo IIα CTR fragments (top) and coprecipitated histone H3 from HeLa cell lysates (bottom). Topo IIα CTR, but not Topo IIα Δ11 or Δ31, copurifies histone H3. Note that the data for the left three control lanes are presented again in Fig. S4 A. (C) Silver-stained protein gel detecting recombinant histone H3 subtypes (H3.1 and H3.3) coprecipitated with recombinant HIS–Topo IIα CTR using anti-HIS beads. (D) Topo IIα CTR binding to a peptide array containing histone H3 residues 16–35 with combinatorial posttranslational modifications (as indicated at the bottom; R, Arg; K, Lys; S, Ser; me1, mono-methylated; me2, di-methylated; me3, tri-methylated; p, phosphorylated). Purified recombinant HIS–Topo IIα CTR was detected strongly at spots (beneath the histograms) containing specific isoforms methylated at R26 and K27, but was not detected when S28 was also phosphorylated. Histograms show signals measured as integrated intensity of spots, subtracting local background. Error bars indicate ±SEM; n = 4. Asterisks indicate a significant difference (P < 0.01) compared with the mean of single-modified peptides. Fig. S1 shows an expanded array. (E) Detection of recombinant Topo IIα CTR coprecipitated with biotinylated histone H3 N-terminal tail (aa 21–44) peptides, either unmodified (Unmod), mono-methylated at Lys 27 (K27me1), tri-methylated at Lys 27 (K27me3), or phosphorylated at Ser 28 (S28p). CTR and peptides were mixed then precipitated with Streptavidin beads. n = 3. Error bars indicate SD. (F) ELISA assay showing binding of HIS–Topo IIα CTR to immobilized H3 (21–44) peptides, fit to a 4 parameter logistic (4PL) curve. Note that H3 (21–44) S28p binding fits the 4PL curve poorly, which suggests a low specificity of binding. A representative example from three experimental repeats is shown. The x axis is a log scale, except to the left of hash marks to allow inclusion of 0 nM HIS–Topo IIα data points on the same plot.

