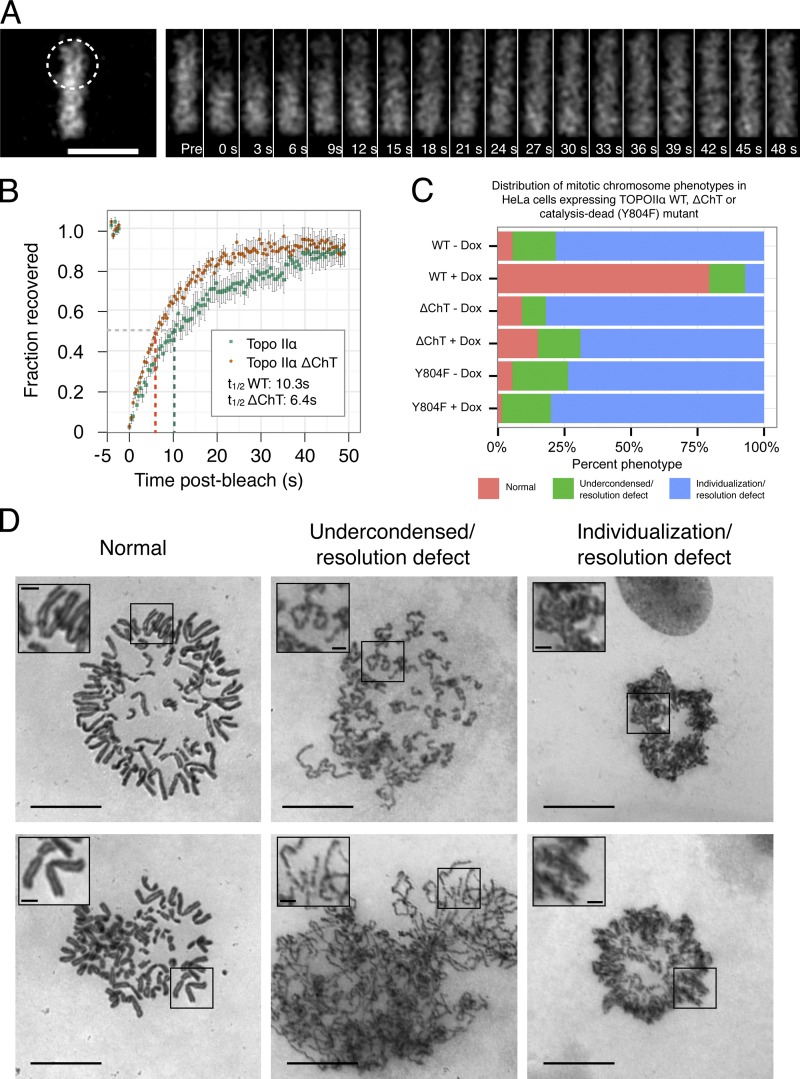
Figure 8.
The ChT domain controls the dynamics of Topo IIα on mitotic chromosomes and is necessary for mitotic chromosome individualization and condensation. (A) Images of a metaphase plate from a representative FRAP experiment using HeLa-EM2-11 mCherry–Topo IIα cells 48 h after induction with doxycycline. A laser-scanning confocal microscope was used to bleach a circular region (broken line) encompassing ∼50% of the metaphase plate, and recovery was monitored over time (seconds). Pre, prebleach image. Bar, 10 µm. (B) Mean FRAP of mCherry–Topo IIα (n = 11 cells) and mCherry–Topo IIα ΔChT (n = 21) in HeLa-EM2-11 cells, as described in A. After collection of prebleach data (top left of plot), images were collected every 0.43 s. Recovery was quantified in the bleached area over 50 s and normalized as described previously for analysis of chromatin proteins (Phair et al., 2004a). Error bars indicate standard error. (C) Distribution of phenotypes seen in cells depleted of endogenous Topo II and induced to express mCherry–Topo IIα, mCherry–Topo IIα ΔChT, or mCherry–Topo IIαY804F. Induction of mCherry–Topo IIα rescues chromosome condensation, individualization, and resolution defects, whereas Topo IIα ΔChT and Topo IIαY804F fail to rescue. Cells were assayed after a double thymidine synchrony and release protocol in conjunction with shRNA-mediated depletion of the endogenous Topo II (see Materials and methods). WT − Dox, n = 129; WT + Dox, n = 141; ΔChT − Dox, n = 100; ΔChT + Dox, n = 100; Y804F − Dox, n = 148; Y804F + Dox, n = 146. (D) Classification used in C. Spreads of chromosomes after depletion of endogenous Topo II show a range of mitotic phenotypes: “Normal” metaphase plates containing individualized chromosomes with visibly resolved sister chromatids (left, red in C), chromosomes that failed to complete linear condensation and sister chromatid resolution (middle, green in C), and failed chromosome individualization and sister chromatid resolution (right, blue in C). Bars, 10 µm. Insets show enlarged views of the boxed regions (bars, 1.25 µm).

