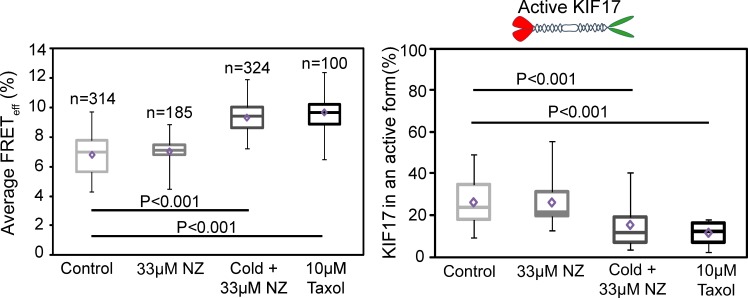
Figure 4.
Active KIF17 is on stable MTs in MDCK cells. Box–whisker plots showing the distribution of KIF17 FRETeff (left) and the fraction of active KIF17 (right) under each experimental condition. Data were obtained from at least three independent experiments ± SEM. Box–whisker plots show minimum, 25th percentile, median, 75th percentile, maximum, and mean FRET values.

