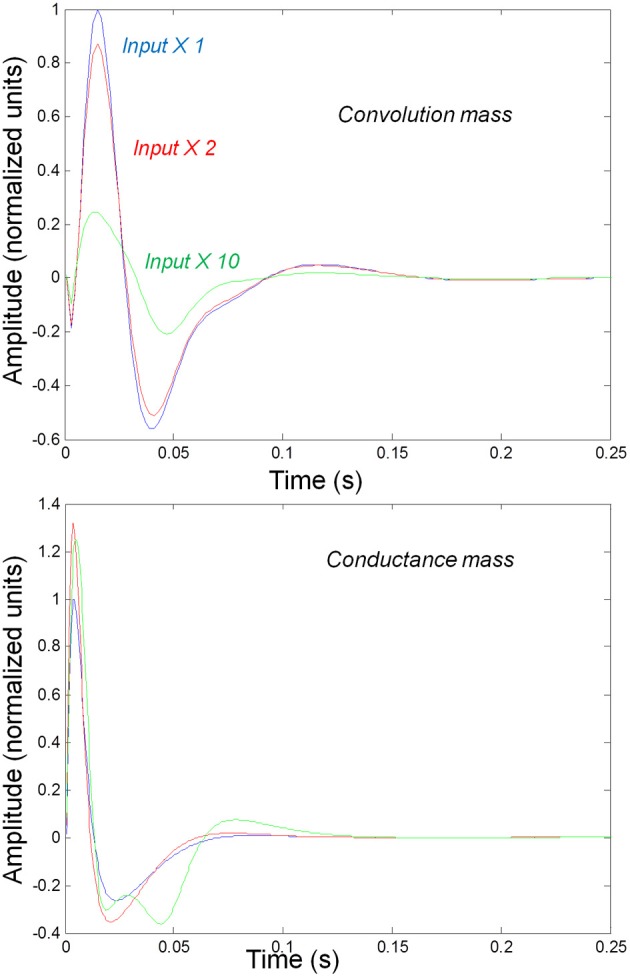
Figure 2.

Responses to impulses of different amplitudes for convolution (top) and conductance (bottom) based neural mass models. The responses are normalized with respect to the amplitude of each input. The blue lines illustrate responses to small perturbations. The red lines illustrate responses to intermediate sized inputs, where conductance based models show an augmented response, due to their non-linearity. The green lines show responses for larger inputs, where the saturation effects due to the sigmoid activation function are evident.
