
Figure 4.
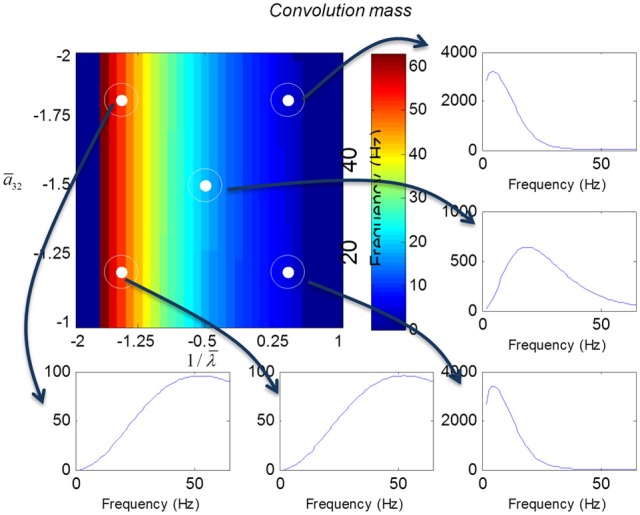
Transfer functions associated with a convolution mass model when changing the excitatory time constant and the connection driving the pyramidal cells over a log-scaling range of (−2, 1) x (−2, −1) (from top to bottom and left to right). The image format summarizes the transfer function in terms of its peak frequency. Transfer functions can be regarded as the spectral response that would be seen if the model was driven by independent (white) fluctuations. They are also the Fourier transform of the impulse response functions of the previous figures.