
Figure 5.
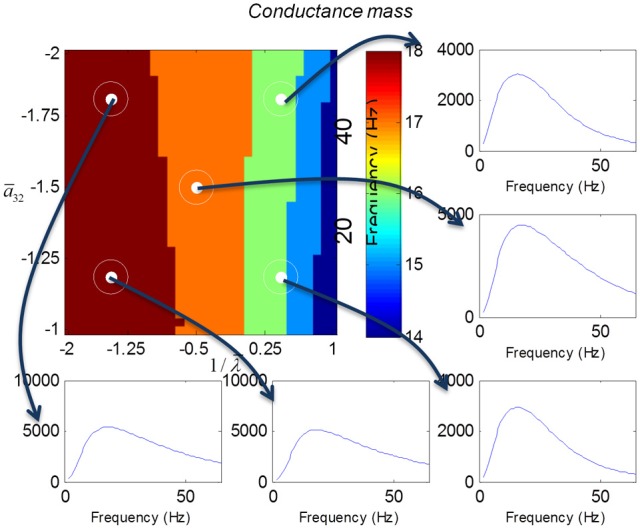
This figure shows the transfer functions of a cortical source described by a conductance mass model. Here, the intrinsic connectivity and excitatory time constant are changed as in Figure 4. Note the alpha and beta peaks that are typical of these models.