Figure 2.

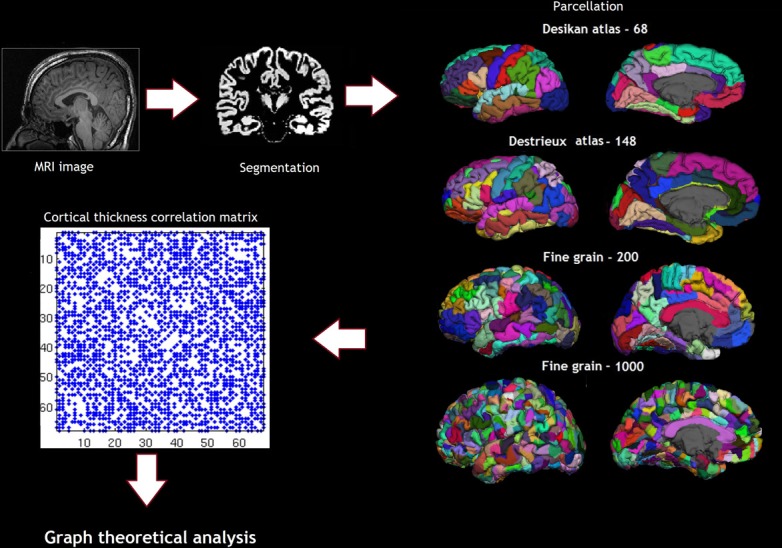
Shows the pipeline of analysis, including the parcellation schemes—Desikan atlas and Destrieux atlas showing the sulcogyral parcellations and the Finegrain 200 and 1000 atlas as in Echtermeyer et al. (2011).

Shows the pipeline of analysis, including the parcellation schemes—Desikan atlas and Destrieux atlas showing the sulcogyral parcellations and the Finegrain 200 and 1000 atlas as in Echtermeyer et al. (2011).