Figure 3.

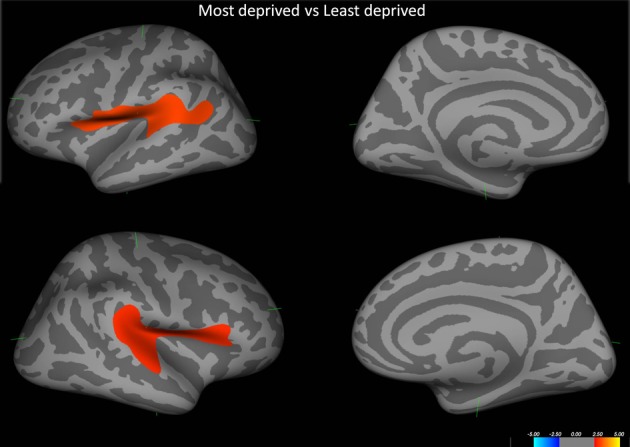
Shows the difference in cortical thickness between the most deprived and the least deprived groups. Red regions pertain to regions where the most deprived group showed cortical thinning. Covariates in the model—Age and alcohol use.

Shows the difference in cortical thickness between the most deprived and the least deprived groups. Red regions pertain to regions where the most deprived group showed cortical thinning. Covariates in the model—Age and alcohol use.