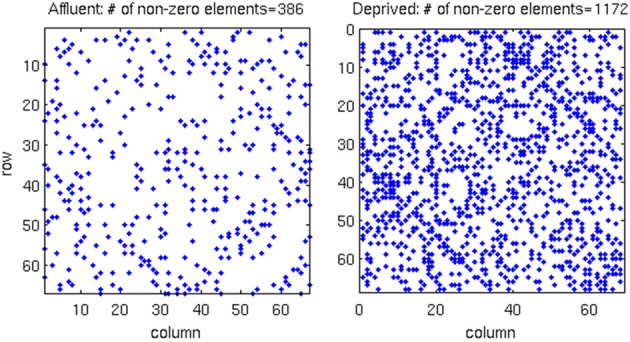
Figure 6.

In the correlation matrix for each group, all values below the FDR threshold are set to zero, where. About three-times more edges survived the FDR procedure in the most deprived than the least deprived group. Affluent: Least deprived; Deprived: Most deprived.
