
Figure 9.
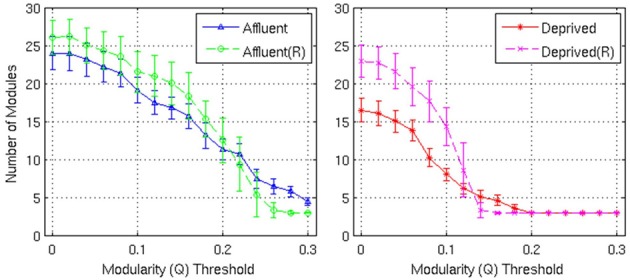
Number of modules and the corresponding random graphs [indicated by “(R)”] with respect to various modularity (Q) threshold. Error bars represent the 1σ-bound for each case. In the module calculation algorithm, if the module contribution, Q or ΔQ, is less than the threshold, it was declared indivisible. Higher thresholds imply strong modules. Affluent: Least deprived; Deprived: Most deprived.