
Figure 2.
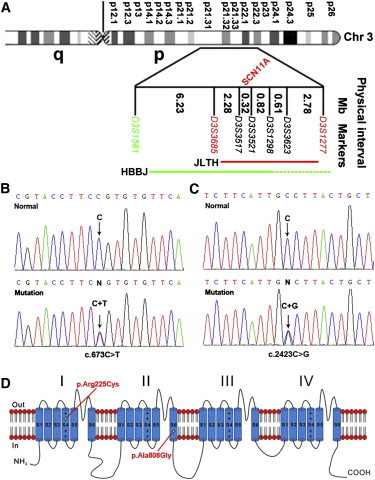
Diagram of Chromosome 3 Showing the Critical Region and Identification of SCN11A Mutations from the JLTH and HBBJ Families
(A) The linkage intervals and flanking markers of the critical region are indicated.
(B and C) DNA sequence chromatograms showing the different heterozygous mutations in SCN11A identified in our study families.
(D) Schematic structure diagram of the Nav1.9 protein with a summary of pain-associated mutations.