
Figure 3.
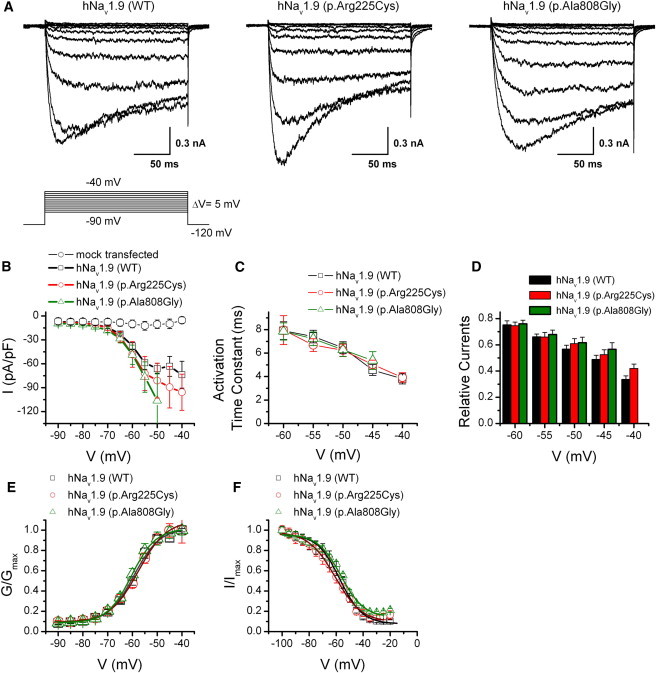
Alterations p.Arg225Cys and p.Ala808Gly Increase Current Densities of hNav1.9 Channels and Leave Voltage Dependence for Activation Unchanged when Overexpressed in Mouse DRG Neurons through Electroporation
(A) Representative whole-cell recordings evoked by voltage for wild-type channels (left) and mutant channels p.Arg225Cys (middle) and p.Ala808Gly (right), respectively. Currents were elicited by 200 ms test pulses stepped from −90 to −40 mV with 5 mV increments. Note the pipette solutions contained 135 mM fluoride. Vh = −120 mV. The recording was performed at least 10 min after achieving whole-cell recording with fluoride to reduce the time-dependent shift of the parameters of current properties.
(B) Current-voltage relationships of p.Arg225Cys and p.Ala808Gly versus the wild-type for data in (A). The peak current density (normalized by membrane capacitance) is plotted (n = 8–15, p > 0.05). The endogenous responses from mouse DRG neurons activated by the same voltage protocol are displayed in hexagons (6 of 16 cells). Data are presented as mean ± SEM.
(C) Mean activation time constant fit by a single exponential equation is plotted against voltage (n = 8–15). There was no significant change for the time-to-peak values from each other (p > 0.05).
(D) Summary plot of relative current at the voltage ranging from −60 mV to −40 mV for WT and two substitutions. For the relative currents, persistent sodium currents (measured at the end of stimulation) were normalized by the respective maximum activation currents (the peak amplitude for activation).
(E) Normalized conductance-voltage relationships. Boltzmann fits correspond to V1/2 = −59 ± 0.7 mV and k = 5.1 ± 0.5 mV for wild-type (n = 16), to V1/2 = −57.7 ± 1.4 mV, k = 5.7 ± 0.7 mV for p.Arg225Cys (n = 20), and to V1/2 = −60.4 ± 0.9 mV, k = 4.8 ± 0.6 mV for p.Ala808Gly (n = 18), respectively.
(F) Steady-state inactivation curves of wild-type, p.Arg225Cys, and p.Ala808Gly are plotted. Steady-state availability data were derived by measuring the peak current amplitude evoked by −50 mV after 500 ms pre-pulse to voltages ranging from −120 mV to 0 mV. The smooth lines are fits to a Boltzmann equation giving values of V1/2 of −57.3 ± 0.7 mV, −60.6 ± 0.9 mV, and −56.5 ± 0.9 mV for wild-type, p.Arg225Cys, and p.Ala808Gly, respectively (p > 0.05). All experiments in the figure were carried out in the presence of 135 mM fluoride in the pipette solutions and 1 μM TTX in the bath solutions.