
Figure 2.
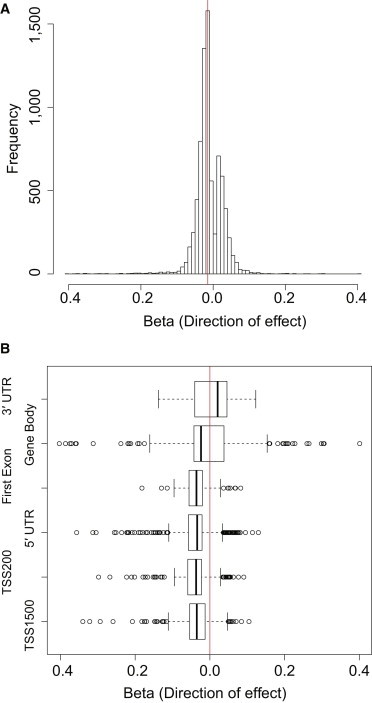
DNA Methylation Variation and the Impact of Gene Expression
We studied the correlation between DNA methylation and expression variation in adipose tissue by associating methylation sites mapping to RefSeq genes or 1,500 bp upstream of the TSS with the corresponding transcripts from the IlluminaHT12 expression array.
(A) Histogram showing the direction of effect (x axis) of all 7,706 associations significant at a 1% FDR; the vertical red line highlights the median value.
(B) Box plot of the direction of effect (x axis) of the significant associations limited to TVSs categorized in groups based on the location(s) of the methylation site (y axis). The five-number summaries in the plot of each group represent the smallest observation, lower quartile, median, upper quartile, and largest observation (sample maximum). The vertical red line indicates the central point of 0.