
Figure 3.
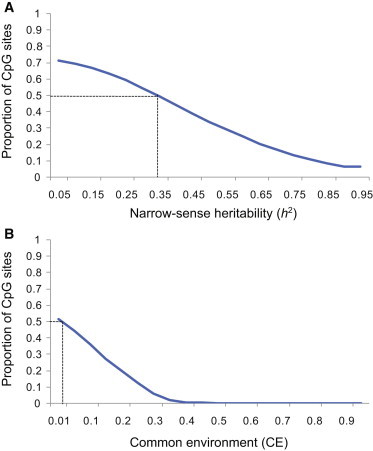
Genetic and Nongenetic Effect on Adipose DNA Methylation
For adipose methylation levels of TVSs (n = 34,430; measured on the Illumina450K array), the proportion of variation attributable to (A) genetic (h2) or (B) familial nongenetic factors (shared common environment [CE]) was estimated. The y axis shows the proportion of CpG sites at the h2 or CE cutoff indicated on the x axis. The dotted line represents median estimates.