
Figure 6.
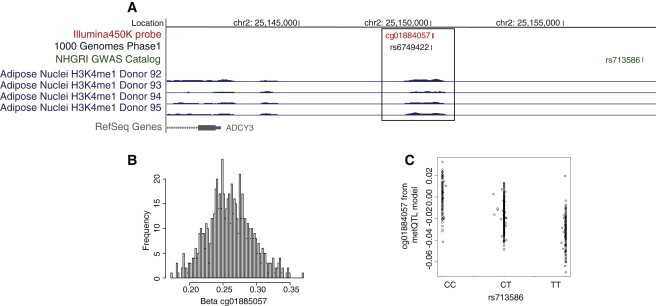
Example Region of a metQTL Overlapping with a BMI Locus Mapping to an Enhancer Element in Adipose Tissue
(A) The methylation site measured by the cg01884057 probe (red panel) mapped to an enhancer bin region (chr2: 25,149,200–25,150,300) identified in four independent adipocyte samples included in the NIH Roadmap Epigenomics Project (blue panel). The methylation site (cg01884057, red panel) was significantly associated (p = 1.5 × 10⁻¹⁴) with the nearby rs713586 SNP (green panel), which is also a GWAS locus for BMI. The rs713586 SNP was in perfect LD (R′ = 1) with rs6749422 (black panel), recently identified in the 1000 Genomes Project.
(B) Methylation profile of the cg01884057 methylation site; the beta-value (x axis) indicates the hypomethylated state.
(C) A scatterplot of the association between rs713586 genotypes (x axis) and cg01884057 methylation (y axis) is represented by residuals from the metQTL model after adjustment for confounders.