
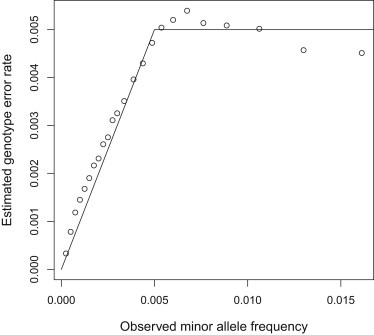
Figure 5.
Genotype Error Estimation in Simulated Data
Estimated genotype error rates obtained from SEQERR are points; the solid line is the actual genotype error rate plotted against the observed error-added MAF. For the lowest MAFs each point is for a single minor allele count value; for higher MAFs several minor allele counts are combined to reduce noise.