
Figure 7.
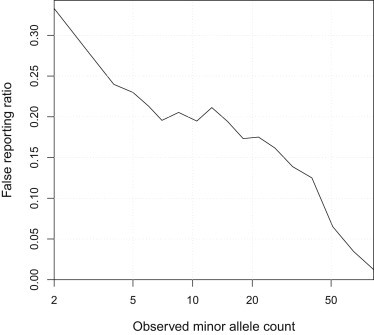
Estimated False Call Rate for Called Heterozygote Genotypes at Low-Frequency Variants in the UK10K Data
The x axis is the observed minor allele count, shown on a log scale. The y axis is the estimated genotype error rate divided by twice the observed MAF.