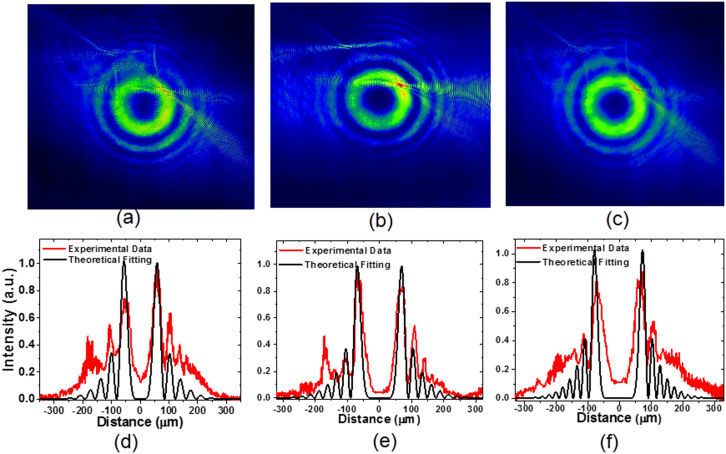
Figure 2. Experimental patterns and theoretical analysis of the SP vortices.
(a)–(c) Experimental patterns of SP vortices using a linearly polarized LG00 mode and PVL with m = −4, −7 and −10, respectively. (d)–(f) Experimental data (red lines) of the intensity distribution through the centers of obtained SP vortex patterns corresponding the patterns (a)–(c), respectively, and the theoretical fitting (black lines) of experimental data (red lines) with respective  functions shown in eq.(2) with n = −4, −7 and −10 and the adjusted size of the pattern.

