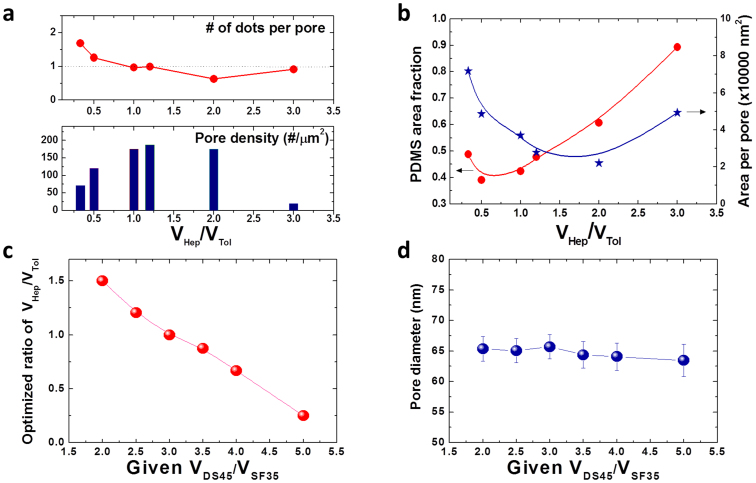
Figure 4. Quantitative measurement data of the BCP blends.
Graphs for the number of dots per pore (a, top) and pore density (a, bottom) and (b) pore area fraction and area per pore at various VHep/VTol ratios. (c) Optimized ratios of VHep/VTol and for diverse VDS45/VFS35 ratios and (d) corresponding pore diameters.

