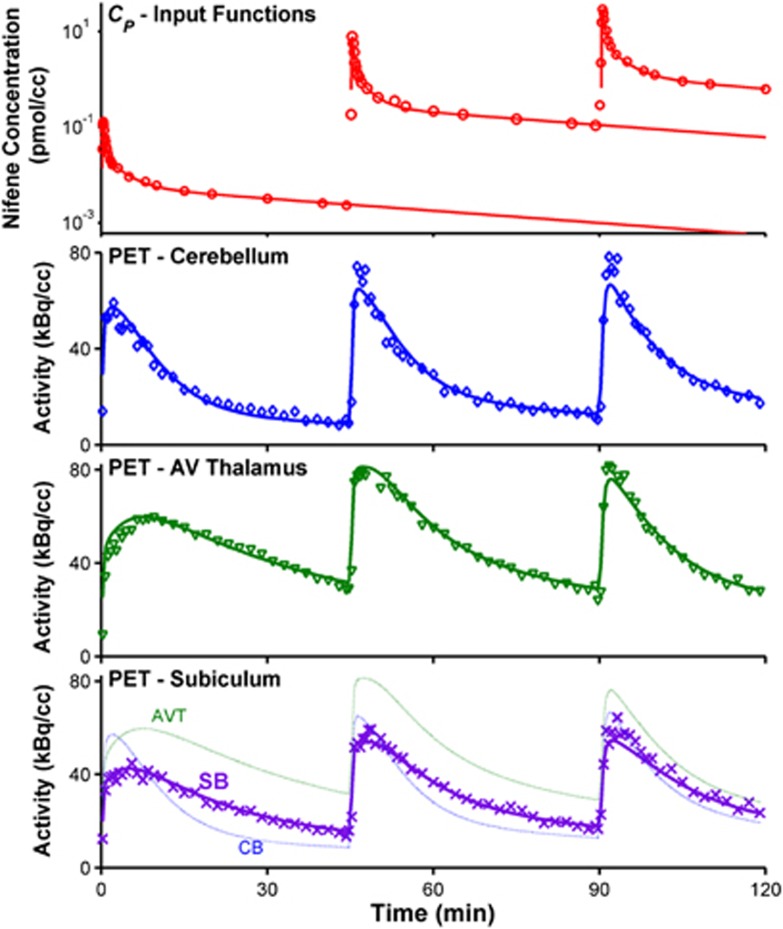
Figure 3.
Compartment modeling of [18F]nifene data. The top plot shows the parent input function CP, with measured blood data (○) and the resulting fit to an analytic function (solid lines) for a sample subject (RH2). The corresponding PET time–activity curves and model fits are shown in the bottom three plots. The observed data are indicated with discrete symbols, whereas the optimized model fit is shown with solid lines. The three regions shown include the negligible binding region of the cerebellum (CB, ◊), the high binding region of the antereoventral thalamus (AVT, ▾), and the moderate binding subiculum region (SB, x). The model fits for all three regions are shown on the bottom plot to provide direct comparison of the PET signal for different levels of specific binding.

