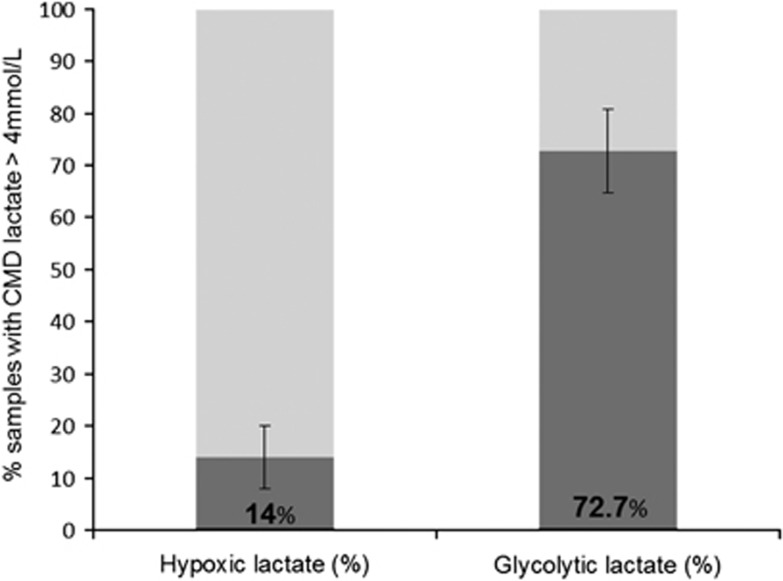
Figure 2.
Cerebral lactate metabolic patterns in patients with traumatic brain injury (TBI) during the total duration of monitoring. Histograms represent individual cerebral metabolic lactate patterns (hypoxic vs. glycolytic) during the entire monitoring duration (average 5 days; n=24 patients). Hypoxic lactate=cerebral microdialysis (CMD) lactate >4 mmol/L with PbtO2 <20 mm Hg; glycolytic lactate=CMD lactate >4 mmol/L with pyruvate >119 μmol/L. Data are mean±s.e.m.

