
Figure 1.
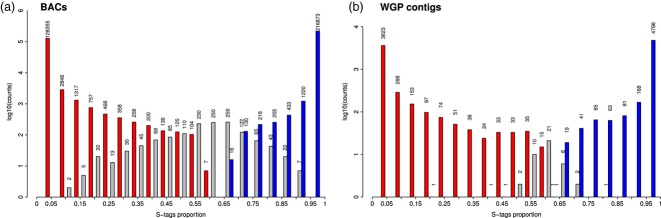
Log10 frequency of the weighted proportion of S tags. A value of 0 indicates a T origin (red bars) and a value of one indicates an S origin (blue bars), according to the enrichment P values (see Experimental procedures). The gray bars indicate counts of: (a) BACs. (b) WGP contigs of undefined origin, i.e. for which unequivocal assignment to S or T was not possible. Absolute counts are given above each bar.