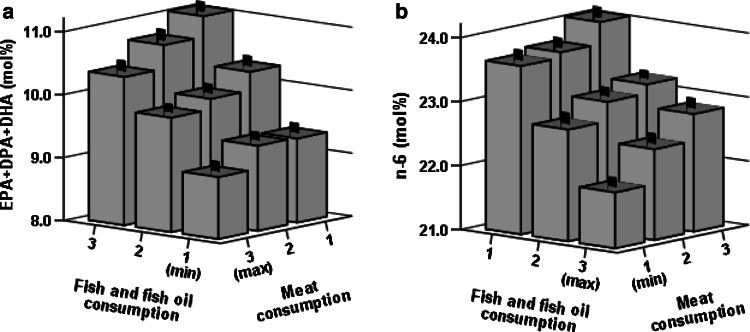
Fig. 1.
Values are means (mol%) and standard errors of erythrocyte membrane sums of EPA, DPA and DHA (a) and n-6 (b) in relation to PUFA weighted tertiles of intakes of fish and fish oil supplement and meat. In both figures P < 0.001 (n = 968) for both intake axes in age, BMI, smoking, statin medication and alcohol consumption adjusted ANCOVA models. 20.5 % of variation (R 2) in n-6/n-3 -ratio was explained by the model. Please note the differing order of categories on the horizontal axes. DHA 22:6n-3, DPA 22:5n-3, EPA 20:5n-3, PUFA polyunsaturated fatty acid

