
Fig. 2.
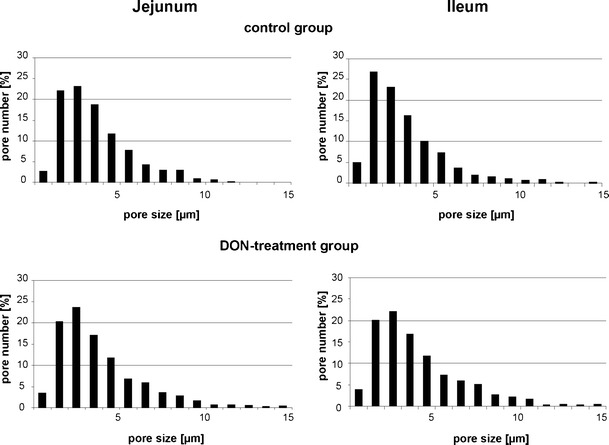
Distribution of the pore size. In the control groups of the jejunum and the ileum, a total amount of 498 (jejunum) and 931 pores (ileum) were analysed. The percentage of the different pore sizes is illustrated. In the jejunum as well as in the ileum, about 80 % of the pores had a size between 0.25 and 5 μm. In the DON-diet groups, a total amount of 788 (jejunum) and 1,035 (ileum) pores were found; 74–76 % of the pores had a size between 0.11 and 0.5 μm