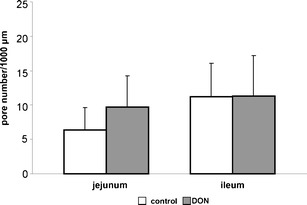
Fig. 4.

Average pore number. The dataset was analysed with an Ftest (for details see “Materials and methods”). Significant differences were found between jejunum and ileum. This was also confirmed with a t test and an increased number of pores were found in the control group of the ileum in comparison to the control group of the jejunum (p < 0.001). A marked effect was found with the F test between the groups (p = 0.097). This result was approved with a t test and a tendency of a higher pore number in the DON-diet group in the jejunum was observed in comparison to the control (control: 6.4; DON-diet group: 9.7; p = 0.055). No differences were found between control and DON-diet group in the ileum (control: 11.26; DON-diet group: 11.36)
