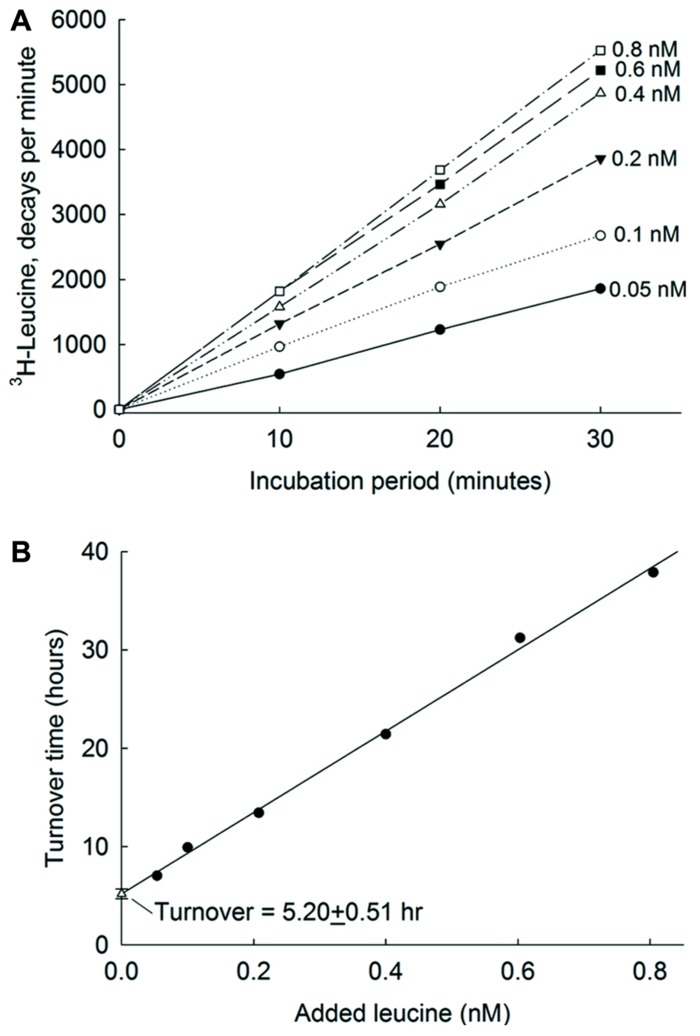
FIGURE 2.
Leucine uptake kinetics in Atlantic Ocean. (A) Incorporation into bacteria of 3H-leucine at 6 nM concentrations. (B) The relationships between added amino acid concentrations and their corresponding turnover times. The error bars show single standard errors. The Y-axis intercept of the regression line is an estimate of turnover time at maximum bioavailable ambient concentration of amino acids. From Zubkov et al. (2008) with permission.

