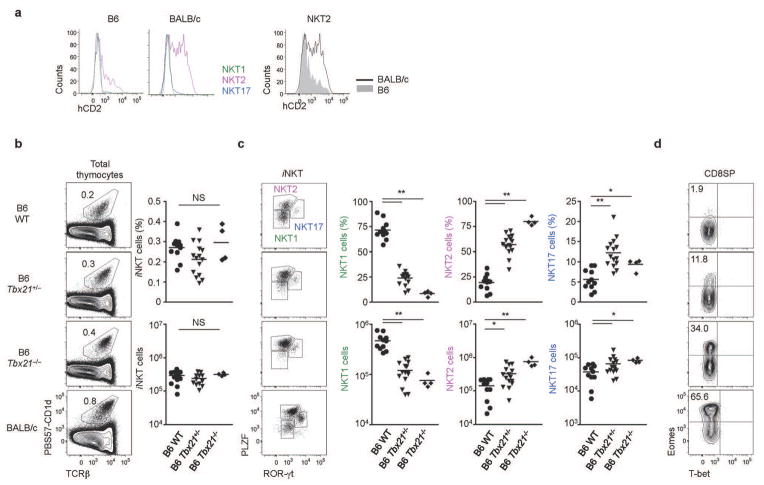
Figure 4. Steady state IL-4 is produced by NKT2 cells, and is enhanced in the absence of T-bet.
(a) hCD2 staining histograms of each iNKT cell subset in B6 and BALB/c mice in the steady state are shown. In the panels on the right, hCD2 expresion on NKT2 cells of B6 and BALB/c mice are overlaid. Data are representative of at least three independent experiments. (b and c) Representative profiles of iNKT cell transcription factor expression are shown (left) with statistical analysis (right) for six week old mice. One-way ANOVA was used to compare B6 WT (N=10), B6 T-bet+/− (N=15), and B6 T-bet−/ − (N=4). ***p<0.001, *p<0.05. Horizontal bars indicate mean values. (d) Representative FACS profiles of T-bet and Eomes staining in CD8 SP thymocytes are shown.

