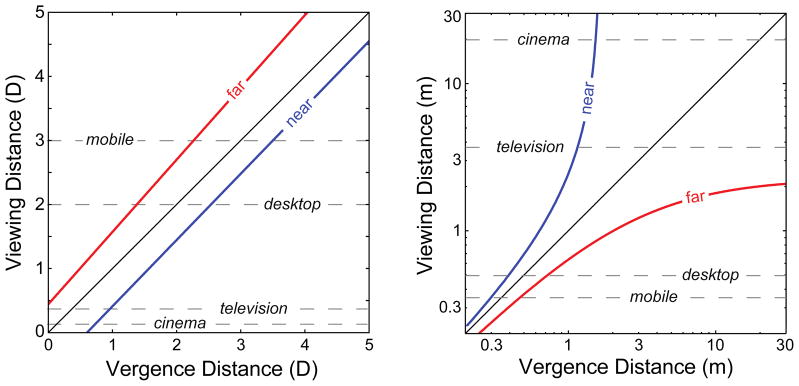
Figure 10.

The zone of comfort in different units. Left panel: Comfort zone plotted in diopters. The abscissa is the distance of the vergence stimulus and the ordinate is the viewing distance, which corresponds to the accommodative stimulus. The black diagonal line represents natural viewing (demand line). The red and blue lines represent estimates from our data of the far and near boundaries of the comfort zone, respectively. The dashed horizontal lines represent typical viewing distances for mobile devices, desktop displays, television, and cinema. Right panel: Comfort zone plotted in meters. The abscissa and ordinate are the distance of the vergence stimulus and the viewing distance (i.e., the accommodative stimulus), respectively. The abscissa and ordinate are plotted on log scales. The black diagonal line again represents the natural-viewing line. The red and blue lines again represent the boundaries of the comfort zone. The dashed horizontal lines represent typical viewing distances for the same devices as in the previous panel.
