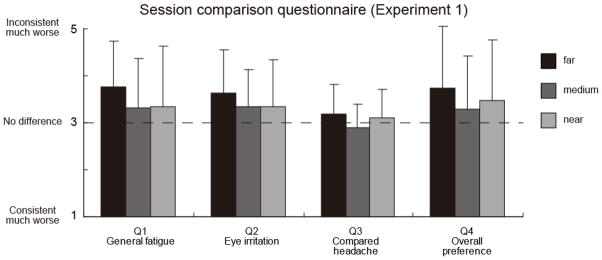
Figure 4.

Results from the session comparison questionnaire in Experiment 1. The average comparative rating of a pair of sub-sessions (one cues-consistent and one cues-inconsistent) is plotted for each of the four questionnaire items. The ordinate represents which sub-session was more favored. Higher values indicate more favorable ratings for the cues-consistent session. ‘3’ indicates the two sub-sessions were equally favored. Error bars represent one standard deviation.
