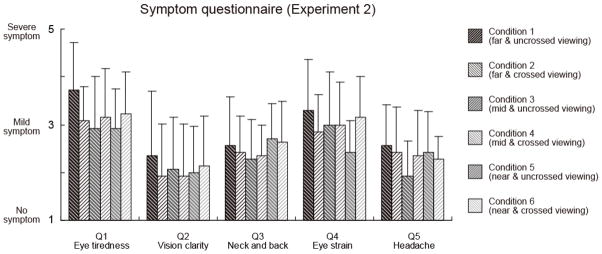
Figure 6.

Results from the symptom questionnaire in Experiment 2. The average severity of reported symptoms is plotted for each of the five questionnaire items. Upper-left striped bars represent symptoms after the three negative conflict (uncrossed disparity) sessions (conditions 1, 3, and 5), and upper-right striped bars represent the reported symptoms after the three positive conflict (crossed disparity) sessions (2, 4, and 6). The darker bars represent longer base viewing distances. The ordinate represents the severity of symptoms. Larger values are associated with more sever symptoms. Error bars represent one standard deviation.
