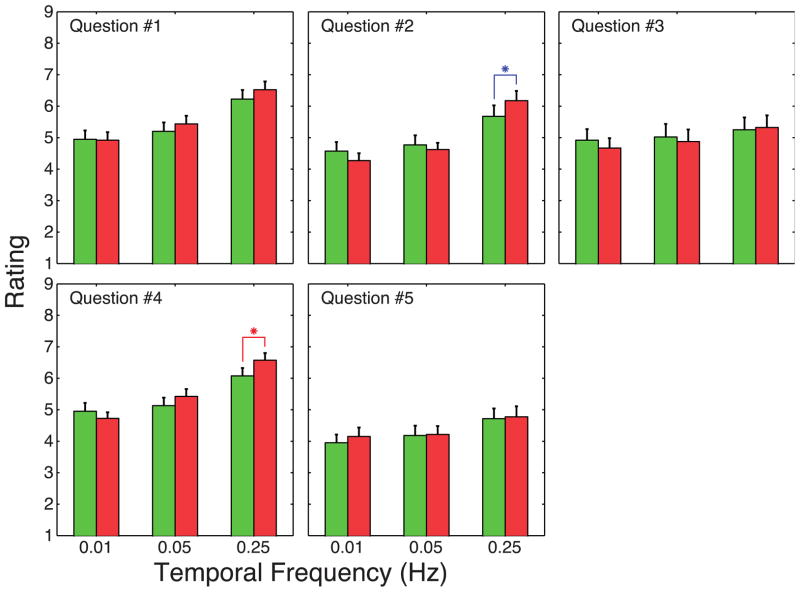
Figure 8.
Results from the symptom questionnaire averaged across subjects. Each panel plots symptom rating (higher numbers representing more severe symptoms) as a function of temporal frequency. Different panels represent results for different questions. Green and red bars represent the results for the natural and conflict conditions, respectively. Red asterisks indicate statistically significant differences between natural and conflict viewing (p<0.05, two-tailed Wilcoxon signed rank test). Blue asterisks indicate marginal significant differences (p<0.10, two-tailed). Question 1 concerned eye fatigue, question 2 concerned clarity of vision, question 3 concerned the neck and back, question 4 concerned how the eyes felt, and question 5 concerned how the head felt.

